
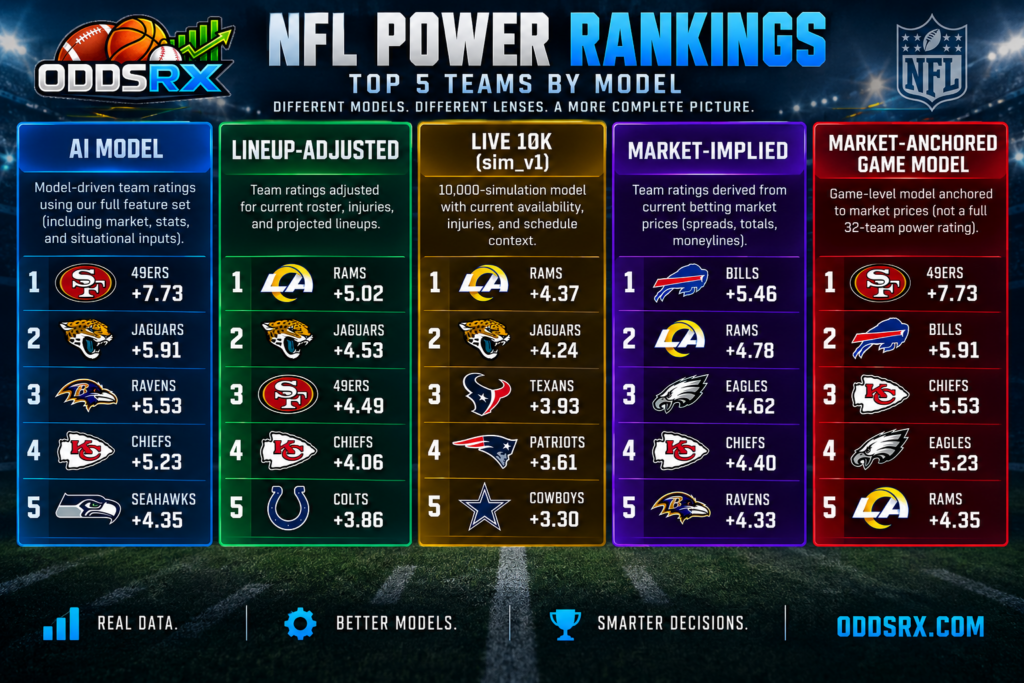
San Francisco looks elite to our AI. The market loves Buffalo. Two models point toward the Rams. And Houston may be one of the NFL’s biggest underachievers.
There isn’t one OddsRX NFL power ranking.
That’s intentional.
A team’s record tells us what happened. The betting market tells us how teams are currently being priced. Performance models evaluate what teams have actually produced. Lineup and simulation models can help answer a different question: How good should this team be based on the players and units currently available?
Put those perspectives next to each other, and the interesting question stops being simply:
“Who is No. 1?”
Instead, we can ask:
Where do the models disagree—and why?
That’s where things get interesting.
Our current NFL boards produce some enormous differences in how teams are valued. The Rams have emerged as the closest thing to a consensus elite team. Jacksonville may be substantially more impressive to the OddsRX models than its market rating suggests. Buffalo presents almost the exact opposite case. San Francisco creates a fascinating disagreement within our own models.
And then there’s Houston.
The Texans might be telling us an entirely different story.
THE RAMS: The Closest Thing to Consensus
Lineup-Adjusted: #1 (+5.02)
Live 10K: #1 (+4.37)
Market-Implied: #2 (+4.88)
OddsRX AI: #6 (+4.00)
If you’re looking for the team with the broadest agreement across different approaches, Los Angeles jumps off the board.
The Rams aren’t No. 1 in every model. That’s actually part of what makes this interesting.
Our lineup-adjusted model has Los Angeles first. Our current availability-adjusted 10,000-simulation model also has the Rams first. The market-implied board has them second.
Even the OddsRX AI model—the least enthusiastic of the four—still has Los Angeles sixth.
That means several very different ways of evaluating NFL teams are arriving in roughly the same neighborhood.
OddsRX takeaway: The Rams currently have one of the strongest consensus profiles in our system.
JACKSONVILLE: Does OddsRX See Something the Market Doesn’t?
OddsRX AI: #2 (+5.91)
Live 10K: #2 (+4.24)
Lineup-Adjusted: #8 (+2.23)
Market-Implied: #16 (+0.25)
This may be the most interesting team on the entire board.
The market-implied model has Jacksonville 16th.
Two OddsRX models have the Jaguars second.
That’s not a small difference. That’s an enormous disagreement about how good Jacksonville actually is.
Our AI model has Jacksonville behind only San Francisco. The freshly updated Live 10K model has the Jaguars behind only the Rams.
The lineup-adjusted model is less aggressive but still puts Jacksonville eighth.
None of this automatically means Jacksonville is a bet. A power-rating disagreement and a playable price are two different things.
But it does mean Jacksonville deserves serious attention whenever the market posts a number.
OddsRX takeaway: Jacksonville is currently one of the clearest cases where our internal models are substantially more bullish than the market.
BUFFALO: Is the Market Charging a Bills Premium?
Market-Implied: #1 (+5.46)
Live 10K: #7 (+2.59)
OddsRX AI: #8 (+3.36)
Lineup-Adjusted: #9 (+1.94)
Buffalo is essentially the inverse of Jacksonville.
The market-implied model says the Bills are the best team in football.
Our other three current team-rating models don’t have Buffalo inside the top six.
Live 10K has Buffalo seventh.
AI has Buffalo eighth.
Lineup-adjusted has Buffalo ninth.
That doesn’t mean the Bills aren’t good. It doesn’t even mean the market is necessarily wrong.
It means something much more useful:
The market currently values Buffalo substantially more aggressively than our other models do.
And price matters.
A team can be excellent and still be overpriced. A mediocre team can be a good bet at the right number. The objective isn’t simply to identify good football teams—it’s to identify differences between probability and price.
OddsRX takeaway: Buffalo is one of the clearest teams to watch for a potential market premium.
SAN FRANCISCO: The Most Fascinating Internal Disagreement
OddsRX AI: #1 (+7.73)
Lineup-Adjusted: #3 (+3.22)
Live 10K: #10 (+2.02)
Market-Implied: #12 (+1.70)
San Francisco might be even more interesting than Buffalo.
Our AI model doesn’t merely have the 49ers first. It has them comfortably first at +7.73.
The lineup-adjusted model provides some support for that assessment, ranking San Francisco third.
Then things change.
Live 10K has the 49ers tenth.
The market has them twelfth.
That’s exactly the kind of disagreement we want multiple models to expose.
Instead of immediately declaring San Francisco “underrated,” the next question becomes:
What does the AI model see in San Francisco that the simulation and market don’t value nearly as highly?
If we can identify the answer, we can determine whether the AI model has found something important—or whether another part of the system is appropriately discounting the 49ers.
OddsRX takeaway: San Francisco deserves a deeper dive. Two models are bullish, while Live 10K and the market are considerably more cautious.
HOUSTON: Maybe the Story Isn’t Underrated. Maybe It’s Underachieving.
Live 10K: #3 (+3.93)
Lineup-Adjusted: #12 (+1.35)
Market-Implied: #18 (-0.32)
OddsRX AI: #21 (-1.62)
Houston might tell us more about the value of running multiple models than any other team.
Look at that spread.
Our performance-oriented AI model has Houston 21st.
The market has the Texans 18th.
But our availability-adjusted Live 10K model has Houston third.
That’s not a normal disagreement.
And it doesn’t necessarily mean our simulation is screaming that Houston should be considered the third-best team in football.
There is another possibility:
Houston has the pieces of a much better football team than the results we’re seeing.
That’s an underachievement story.
The performance model sees what Houston has actually produced and doesn’t like it.
The market has reacted accordingly.
But the simulation still sees considerable underlying strength in the personnel and units available to the Texans.
Now we have a much more interesting question to investigate.
Where are those points disappearing?
Is it offensive efficiency?
Protection?
Red-zone execution?
Turnovers?
Fourth-down decisions?
Game management?
If those problems are structural, the simulation could be too optimistic.
If they’re correctable, Houston could eventually close a substantial gap between its underlying ability and actual production.
OddsRX takeaway: Don’t automatically label Houston underrated. The better description right now may be underachieving.
KANSAS CITY: Quietly, There’s Quite a Bit of Agreement
Market-Implied: #3 (+4.50)
OddsRX AI: #4 (+5.23)
Lineup-Adjusted: #5 (+2.64)
Live 10K: #12 (+1.34)
Kansas City isn’t generating the wild discrepancies we see with Houston, San Francisco or Jacksonville.
And that’s noteworthy too.
Three of the four models essentially agree that Kansas City belongs around the top five.
Live 10K is the clear dissenter, placing the Chiefs 12th.
That gives us another useful question to monitor as the season progresses: does the simulation eventually move toward the other models, or are the underlying current-unit numbers identifying weakness that the broader models and market haven’t fully incorporated?
OddsRX takeaway: Kansas City has strong top-five support across three models, with Live 10K as the notable exception.
The NFL Model Disagreement Board
Here’s the simplest way to summarize what our models are telling us right now:
LOS ANGELES RAMS — CONSENSUS
Multiple independent approaches see an elite team. The Rams are #1 in both the lineup-adjusted and Live 10K models and #2 in the market.
JACKSONVILLE JAGUARS — ODDSRX MUCH HIGHER THAN THE MARKET
AI #2. Live #2. Market #16.
That’s a discrepancy worth watching every week.
BUFFALO BILLS — MARKET MUCH HIGHER THAN ODDSRX
Market #1. Our other current models: #7, #8 and #9.
Buffalo may carry a premium that matters when evaluating individual game prices.
SAN FRANCISCO 49ERS — INTERNAL DISAGREEMENT
AI #1 and Lineup #3.
Live #10 and Market #12.
Something is driving that divide, and finding it is more valuable than simply averaging the rankings together.
HOUSTON TEXANS — UNDERACHIEVING?
Live #3.
AI #21.
That may be the clearest example of a team whose underlying pieces look considerably better than its actual performance.
Power Rankings Tell You Who’s Good. Disagreement Tells You Where to Look.
That’s the reason OddsRX doesn’t need every model to produce the same answer.
In fact, we don’t want them to.
If four models built from different information always agree, we’re probably not learning very much from having four models.
The interesting information appears when they disagree.
Why does the market love Buffalo more than our models?
Why do AI and Live 10K like Jacksonville so much more than the market?
Why does AI see San Francisco as the NFL’s best team while Live 10K has the 49ers tenth?
And how can Houston look like a bottom-half team based on actual performance while an availability-adjusted simulation still sees top-tier underlying strength?
Those aren’t problems with a multi-model system.
Those are the questions the system is designed to uncover.
And as the season progresses, we’ll get to see which signals persist, which disappear and which models adjust first.
Explore the NFL Power Board on OddsRX and compare the models yourself.